Exporting XCode Coverage Report to a Spreadsheet
Luke, 26 Oct 2018
The medical app Im currently working on is being built within some very strict guidelines, as it qualifies as a medical device for use in hospitals. One of the things we need to do is provide unit tests for as much code as possible, and for code that isnt unit-tested, we have to explain why.
To that end, Ive got better at exporting coverage data from XCode, and bringing it into a spreadsheet where I can add things like a 1 or 0 in a column for whether or not something should be included in an overall coverage % value. The process only takes a few minutes, once you are set up – but the setting up first time round can take a little while. Heres how its done :
I use a command-line tool called Slather to print out all the most recent coverage data. To install Slather, you need first to have an up-to-date version of Ruby installed locally on your Mac. The system version of Ruby that you will already have, is not writeable, and is fixed to an older version. What you need is another installation of Ruby, which you can control entirely. RVM stands for Ruby Version Manager, and it is a tool you can install which will let you have multiple versions of Ruby installed on your machine – one being the system one which you leave alone, and the other being a brand new installation which you can do whatever you like with. Incidentally, with this new version of Ruby, you dont need to use the command ‘sudo ..’, because you have full write access with it. RVM then lets you switch between Ruby installations, ie from the system one to the custom one.
I wont go into installing RVM here, there are many articles out there covering this. I can recommend this one.
Once you have a new version of Ruby installed, you can now install Slather in your new Ruby version.

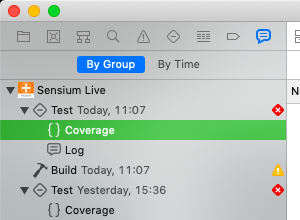
This latest report is the one that Slather will find when outputting data. The following command to run Slather, works for me based on the name of my current project, and its parent xcworkspace :
slather coverage -s --scheme "Sensium Live" --workspace "Sensium Mobile Demo.xcworkspace" "Sensium Mobile Demo.xcodeproj"
The name of my target within XCode is ‘Sensium Live’, my .xcodeproj is called “Sensium Mobile Demo.xcodeproj”, and my workspace is called “Sensium Mobile Demo.xcworkspace”. So obviously, swap out all those things for the project you are testing. Again – ensure you are at the root of your project in Terminal.
What should follow then if everything went ok, is a simple text dump of your report, something like this :
Sensium Mobile Demo/AlertConfirmationViewController.swift: 0 of 83 lines (0.00%)
Sensium Mobile Demo/AppDelegate.swift: 33 of 71 lines (46.48%)
Sensium Mobile Demo/ChartContainerView.swift: 72 of 603 lines (11.94%)
Sensium Mobile Demo/CoreData/Patient+Extension.swift: 272 of 334 lines (81.44%)
Sensium Mobile Demo/DownloadManager.swift: 321 of 571 lines (56.22%)
What I then do is import that into my current spreadsheet of choice, Google Sheets. For that particular app, heres how the import process works.
First, copy and paste all of that data out of terminal, and into any text editor, saving it as a .txt file. Then open a spreadsheet in Google Sheets. You want to add a new sheet to your spreadsheet with that data on it, so go to File menu, Select Import, and on the dialogue that appears, select Upload.
Find the text file you have just created with your coverage data in it, and choose it for upload. On the Import File dialogue that then appears, choose Import Location as ‘Import new sheet(s)’, then on separator type, click Custom, and enter a space ‘ ‘ in the box next to it. This puts each number in the coverage data into its own box in the spreadsheet, making it easier to sort.

Click Import Data, and thats it. You can now sort by % covered for example, or you can do as I do and add column to include or exclude the given file. I tend to use ViewModel architecture in my apps, so I include View Models for unit testing and exclude View Controllers. By excluding files like that I can end up with a figure for overall coverage which is much more accurate, and encouraging too as it is higher.