The SwiftUI Profiling tool in Instruments
Luke, 30 Jul 24
Introduction
One of the downsides of the declarative world of SwiftUI, if youve come from a more imperative UIKit kind of world, is that its not always clear exactly when a view has been redrawn, and why, because SwiftUI handles the decision making around redraws under the hood. But the SwiftUI profiling tool is there to get to the bottom of that for you. Heres a quick guide into how it works.
Basic testing
First the basics: ensure the target simulator you wish to test with is selected from the simulator list and choose Profile from the Product menu in XCode. The code will be built for profiling, and then you get the choice of XCode tools - select SwiftUI from the list.
Once the tool is opened, tap the Record button top left to start profiling. With the current iteration, and with a big project, sometimes data doesnt appear for each of the streams in the list (View Body, View Properties, Core Animation Commits, etc), so if the streams appear blank for any reason, just stop and restart.
Each time you restart, you are creating a new 'run' You can flick through these runs to look at previous tries, by using the forward and back arrows highlighted in this image: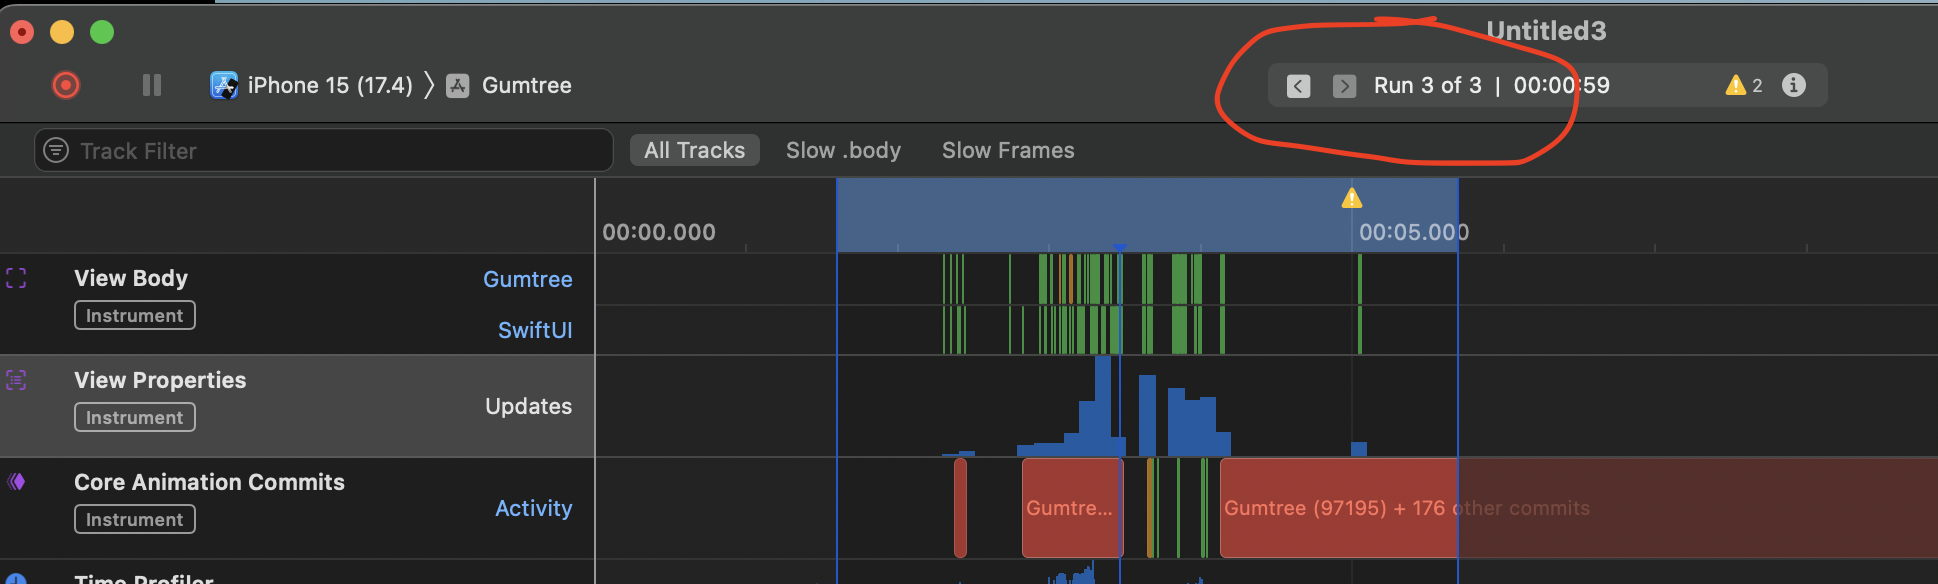
Finding the area you want to test
As you use the app in the simulator while the profiler is recording, watch the data appear as you navigate the app. At the point where you particularly want to check performance, for eg, on the opening of a particular screen - make a note of the data being populated. You can stop recording once this data has been recorded, so you can start analysing whats going on. To begin, drag from left to right across the data on the timeline, so that the detail view below is populated with the data that youve highlighted.
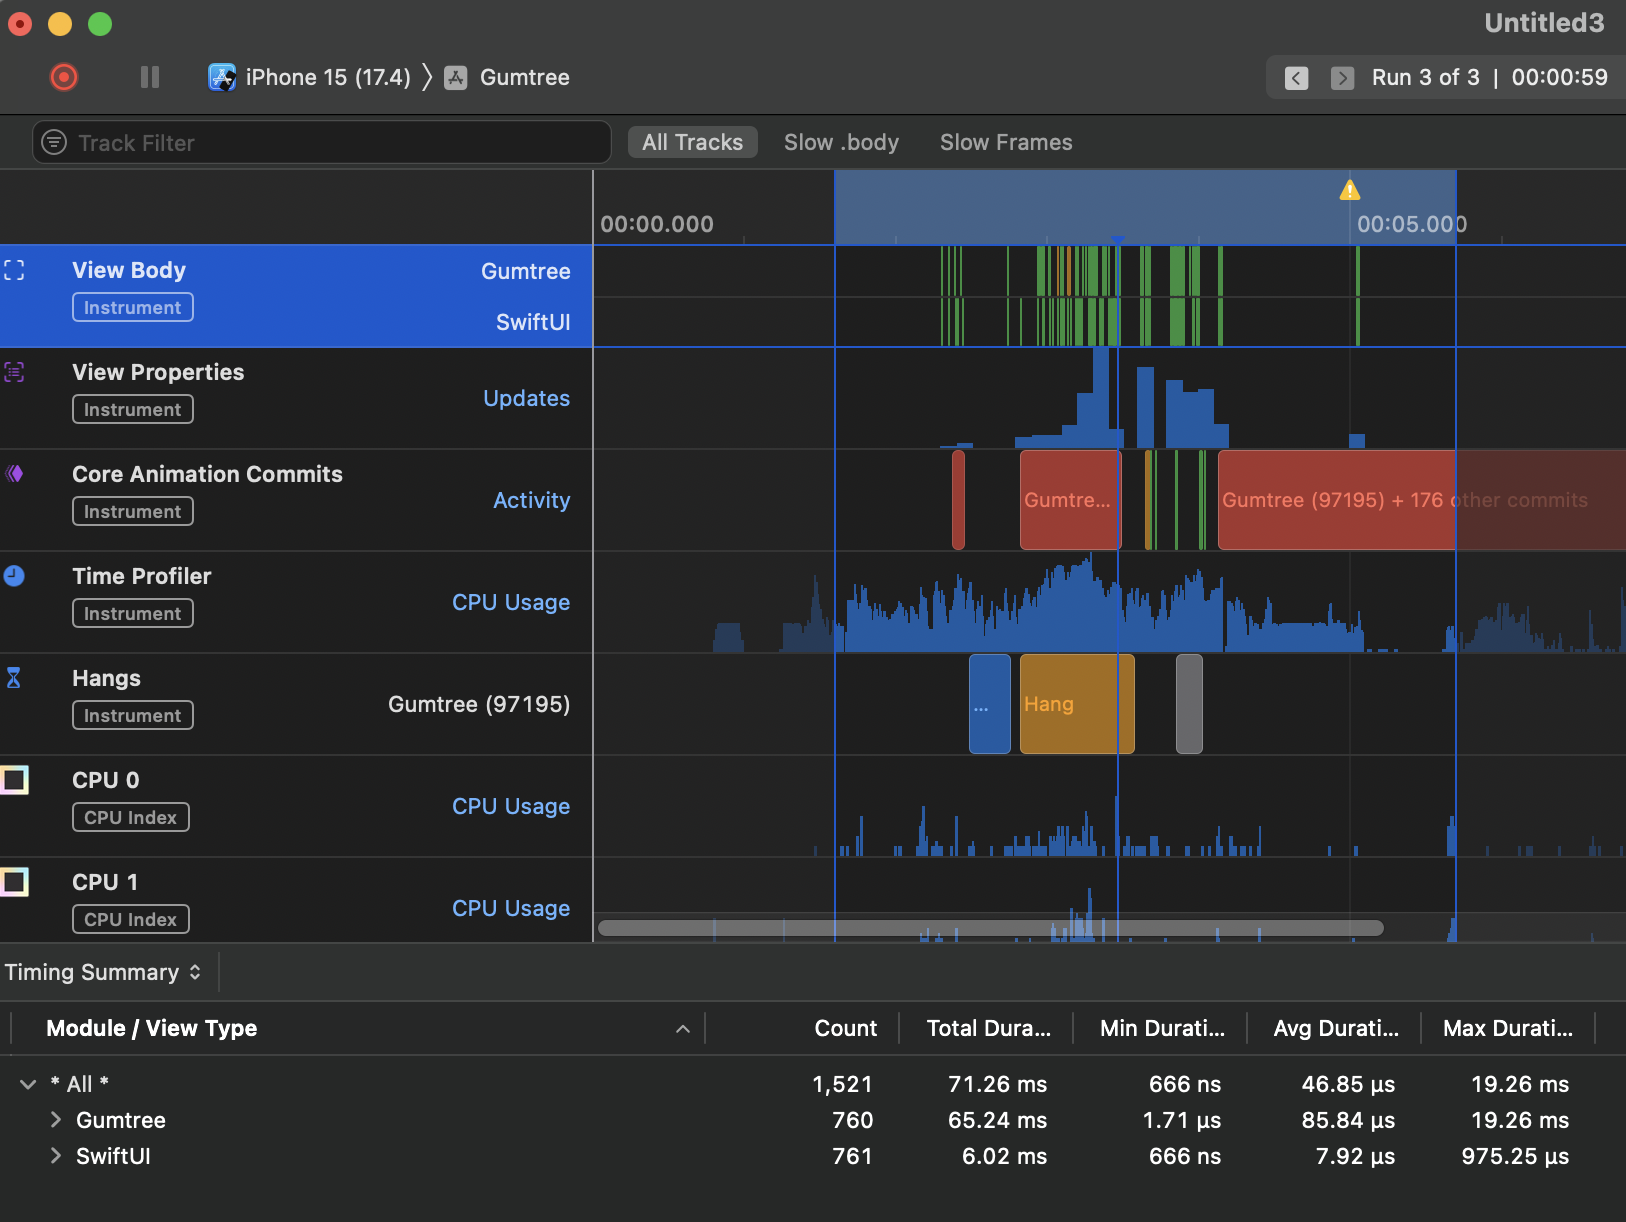
View Body
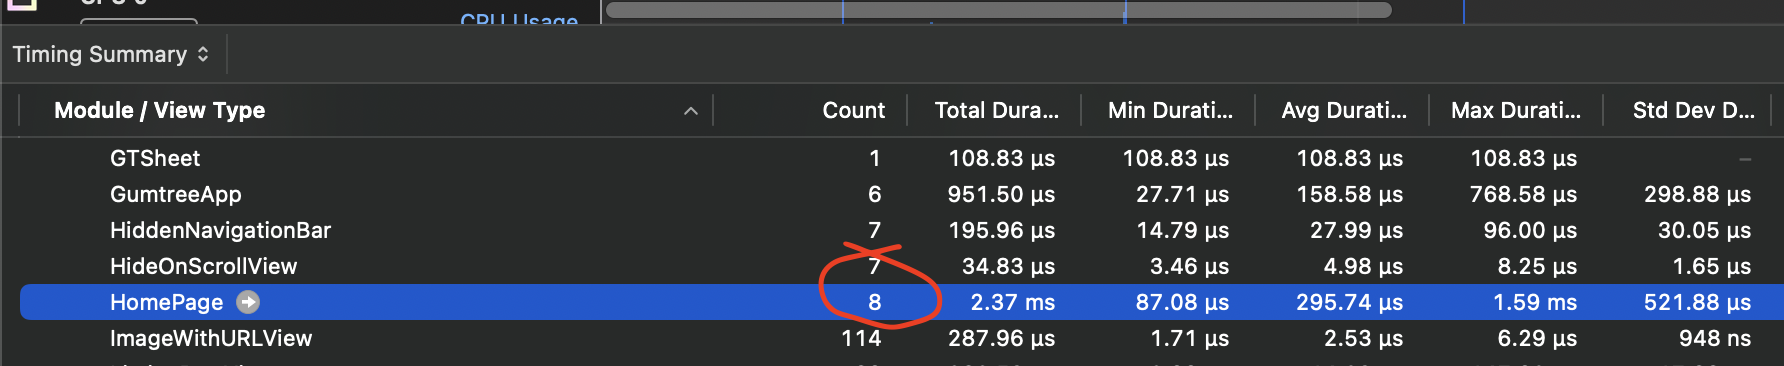
By clicking on the first row at the top of the data named View Body, you are populating the detail view below with details on the triggering of the view body function for each of the views on screen. You can then drill down into the data to get basic information on how many times that view has been drawn, for the timeline that you have highlighted. In the following image you can see that the HomePage view for example, has been redrawn 8 times for the time selected:
But Why ..
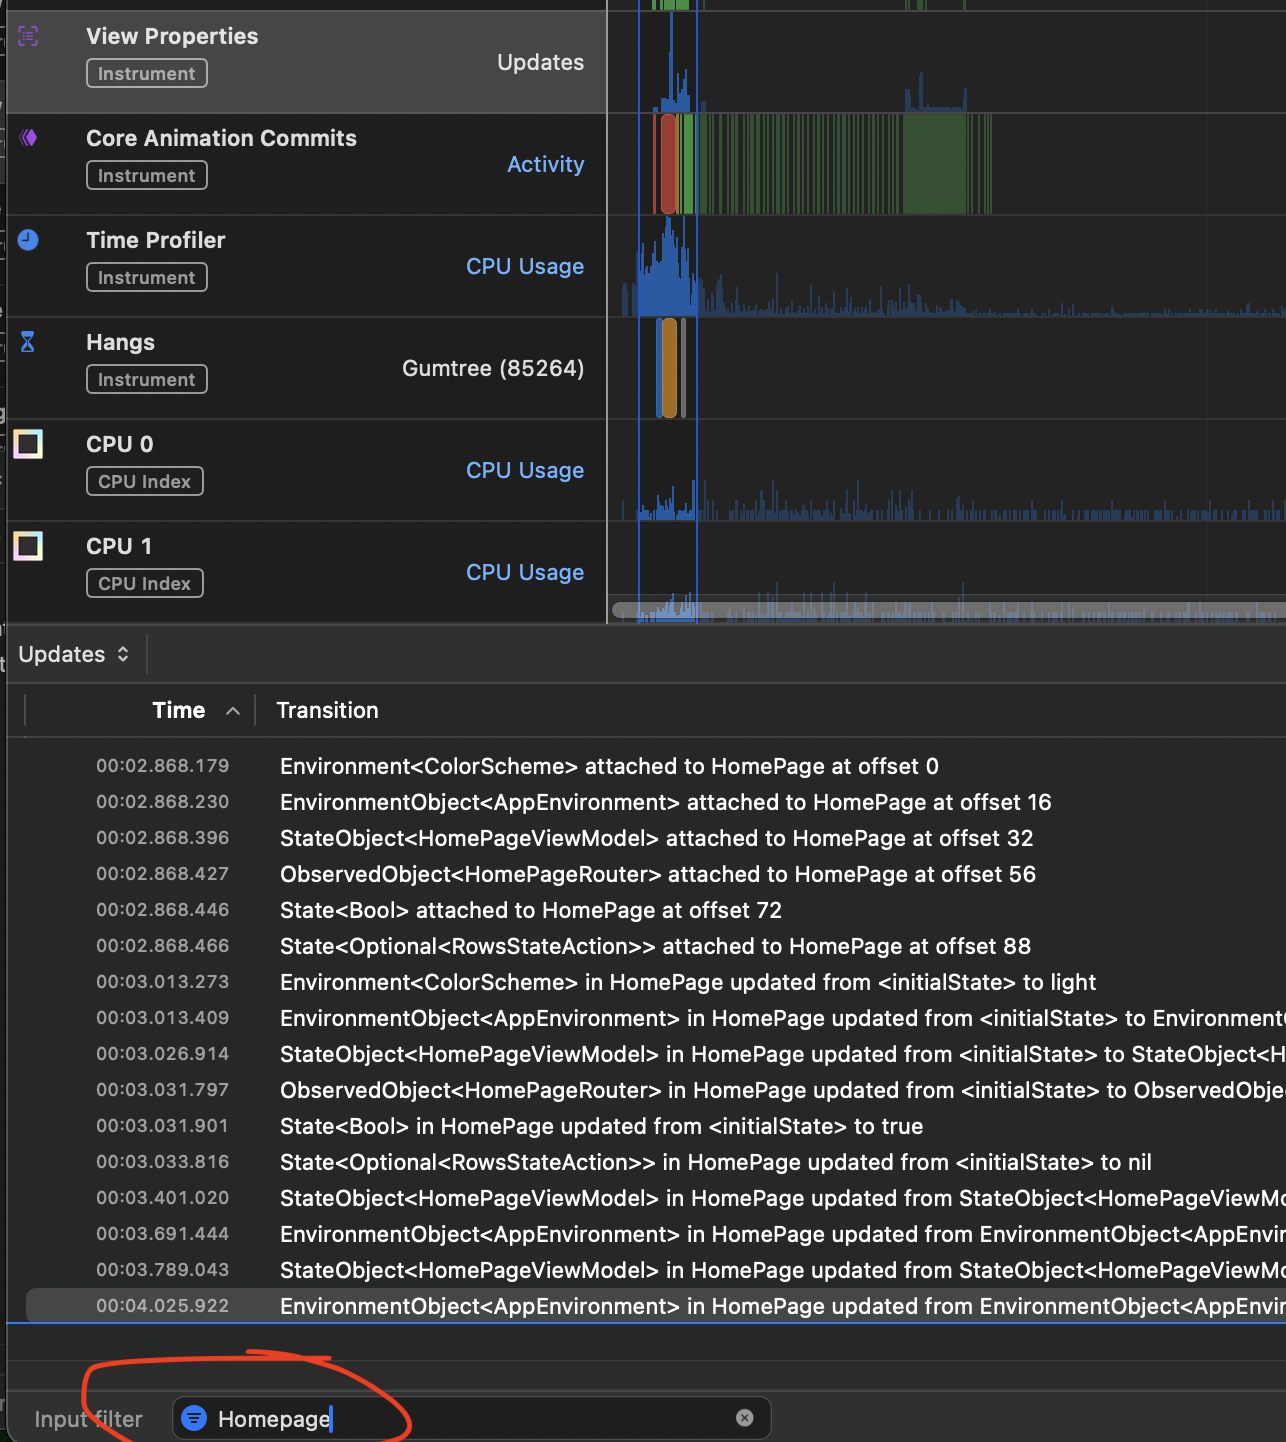
To find out more about why there were 8 redraws of that screen, change the selecting row of main data to View Properties by tapping on it. Its also important here to pay attention to the little dropdown above the data, which can now change between Summary (update counts), Current Values (what each property that causes a redraw is currently set to), and Updates - a chronoligical ordering of what happened to the view properties and when, starting with initial state and moving on through all the changes. Its useful here to filter by the view you are particular concerned with, by entering the name of the view in the bottom left Input Filter:
So by having a close read of all the changes listed there, you can see exactly why the view was redrawn, and potentially look to changing your properties in some way so that redraws dont occur if unnecessary.